Exercise selection is an important programming variable for both performance and health outcomes. From a performance standpoint, the type(s) of exercises selected play a major role in determining the specific strength and hypertrophy adaptations that take place. Additionally, exercise selection can influence the adherence to physical activity through affective responses, e.g. enjoyability, and by modulating the locus of control, e.g. self-efficacy. Baz-Valle 2019 Williams 2008
While the current evidence on longevity and disease prevention makes a strong case for improving strength, increasing lean body mass, reducing excess fat mass, and improving cardiorespiratory fitness, there is no evidence that strength in specific movements or rep ranges, e.g. a 1- rep max back squat, provide any unique health benefits compared to other movements, save for being able to perform a heavier 1RM back squat. In line with this sentiment, the current physical activity guidelines pertaining to resistance training recommend. “8 to 10 exercises for the major muscle groups, performed on 2 or more nonconsecutive days/week, using a resistance such that 8 to 12 repetitions result in volitional fatigue.” Wescott 2009
However, deciding which exercises should be included in order is not quite as straightforward. In this article, we’ll take an in-depth look at the differences and similarities of front squat and back squat in order to shed some light on a coach’s decision-making process in selecting one over the other. In order to do this, we’ll have to discuss a number of different topics pertaining to coaching theory, exercise testing and our first topic, physiological adaptations to exercise.
Key Points:
- Surface electromyography (sEMG) is a tool used to measure muscle excitation based on changes in electrical activity of the muscle fiber. Greater sEMG amplitude tends to map with greater motor unit recruitment, though the relationship between sEMG and performance outcomes, e.g. strength and hypertrophy, is complicated.
- Muscles have specific force production capacity for a given length, angle, contraction type, and movement velocity. Changing one of these variables changes the force production potential, though not necessarily the amount of muscle mass being trained or the magnitude of training adaptation potential.
- Front squats and back squats have nearly identical sEMG amplitudes at submaximal and maximal loads, despite front squats using significantly less weight.
*Note: This article was originally published in our June Research Review. We have taken a break from this project in order to work on our upcoming Barbell Medicine Certificate Program.
Background:
To be clear, there are no additional specific guidelines for exercise selection for improving general health. In contrast, athletes with well-defined sporting demands tend to have a narrower range of appropriate exercises- particularly during the relatively brief periods of specific preparation for a competition- though both groups are likely to benefit from a substantial amount of exercise variation. Increased movement variability has been shown to improve movement proficiency and motor learning skills in specific tasks Wu 2014 Dhawale 2017. Additionally, there is substantial evidence across multiple sports that reduced variation, e.g. early specialization, is associated with an increased risk of injury (particularly among youth athletes), as well as with poorer long-term performance outcomes. Post 2017 Bell 2018 There is also some evidence that increased exercise variation may improve 1 rep-max performance compared to reduced variation, though hypertrophy outcomes tend to be similar. Fonseca 2014
Physiological Adaptations to Exercise
Strength is force production that is measured in a specific context. For example, a powerlifter completing a heavy 1-Rep-Maximum (1RM) squat is displaying force production in one context, e.g. maximal strength, whereas a marathoner is displaying force production in much different context, e.g. strength endurance. While there are other types of strength, e.g. high-velocity or explosive strength, the common ground shared by all includes both force production and a specific context.
Strength’s specificity is best explained by the Specificity of Adaptation to Imposed Demands (SAID) Principle, which posits that the greatest fitness adaptations produced from training will be specific to the stimulus applied by the training. In other words, each exercise specifically stimulates adaptations for a particular energy system, muscle or muscle group, movement pattern or pattern(s), range of motion, joint angle, muscle position, movement velocity, etc. Thomas 2009 What’s more, is that each muscle has a maximum force production capacity that occurs at a specific position, length, movement velocity, contraction history, etc. Herzog 2004 Thus, strength is specific to a host of different variables that must be accounted for when assessing if an individual is getting stronger and picking exercises in order to do so.
Muscular force, e.g. tension, is produced by muscle fibers receiving an electrical signal to contract. The group of muscle fibers that receive the electrical signal from a single motor neuron is called a motor unit. Each muscle group has a pool of motor units that are recruited in order to produce force. At any given muscle length, movement velocity, and contraction type, muscles modulate force production by altering either the amount of motor units being recruited and/or the frequency at which the signal to contract is sent to the muscles.
While it may seem logical that heavier loads require more motor unit recruitment than lighter loads, recent evidence suggests that during dynamic movements, most motor units are recruited similarly during both light (<50% 1RM) and heavy (>85%) efforts. Potvin 2017 For example, a study by van den Tillaar showed that there was similar activation of the quad muscles when doing single repetitions at loads ranging from 50% to 90% of a 1RM squat. van den Tillaar 2019 Rather, the major difference between lighter and heavier efforts does not appear to be the amount of muscle mass used, but rather how frequently they get the signal to contract, which is known as rate coding. Potvin 2017 Finally, the force production capacity of a muscle at a specific length, velocity, and contraction type is related to the cross sectional area of the muscle, e.g. the size of the muscle fibers in the motor units being recruited or hypertrophy. Jones 2012
It should be noted that increases in rate coding occur at light weights when the set approaches failure, however the adaptations secondary to this increase in rate coding tend to be related to sustaining force production for longer periods of time, e.g. stamina and endurance, compared to maximal force production. Vila-Cha 2010
To tie this all together, in order for an exercise to be a viable candidate for promoting strength, it should have as much in common with the test as possible with respect to movement and bioenergetic characteristics.
Hypertrophy
In adults, hypertrophy is the main process by which skeletal muscle size increases. Net hypertrophy occurs when muscle protein synthesis exceeds muscle protein breakdown for sustained periods of time. While muscular hypertrophy is a complex process involving many hormones, signaling pathways, and exercise considerations, the main inputs include:
Mechanical Loading – during human movement, muscles create force to control body movements. This force, known as mechanical tension, is essential for muscle growth. In short, if a muscle is not required to create force, it is unlikely to grow. Schoenfeld 2010 That said, we should not conflate the creation of mechanical tension with muscle excitation, e.g. motor unit recruitment. For example, stretching a muscle creates tension, but does not require motor unit recruitment in the muscle being stretched. Recent human data showed that individuals following 6 weeks of static stretching, but no other exercise, increased the size of their calves. Simpson 2017 That said, it is unlikely that hypertrophy will be maximized without motor unit recruitment.
Motor Unit Recruitment -As mentioned above, motor unit recruitment is about the same across different loading ranges, though the frequency in rate coding increases the heavier the weight is. Unfortunately, it is still unclear how much contribution getting closer to failure actually has, as there are studies showing equivalent outcomes when training relatively far away from failure as compared to going all the way to failure. Parejac-Blanco 2016 Sampson 2016 From a practical standpoint however, it seems that when individuals train somewhere near failure, e.g. ~4-5 Reps in Reserve or less, the amount of motor unit recruitment appear to drive hypertrophy fairly equally. This is bolstered by a recent meta-analysis by Schoenfeld et al. that included 21 studies comparing low-load to high-load resistance training, which found that hypertrophy outcomes were about the same in either scenario. Schoenfeld 2017
Range of Motion – increasing the range of motion tends to require the involvement of more muscle mass compared to movements with less range of motion. Newmire 2018 Additionally, increasing the stretch of the muscle by using a larger range of motion tends to impart increased mechanical loading on the muscle, which appears to be additive to the muscular tension required to complete an exercise. Schoenfeld 2010 With that said, partial range of motion exercises still produce hypertrophy, although it tends to be in less muscle mass overall and atrophy more quickly during periods of detraining. McMahon 2013
Metabolic stress – Resistance training primarily involves anaerobic glycolysis to create energy (ATP). This results in the buildup of metabolic byproducts such as hydrogen ions, inorganic phosphate, creatine, lactate, and others. When the muscles are required to create force repeatedly in an anaerobic environment, more and more metabolic byproducts are generated. Numerous studies show that increased concentrations of these byproducts signal anabolic pathways in skeletal muscle, thus driving muscular hypertrophy. Goto 2005 Smith 1995
Muscle Damage – From an anatomy standpoint, muscles are composed of many muscle fibers, which are grouped together in bundles called fascicles. Additionally, every muscle fiber is composed of many myofibrils – the contractile proteins of muscles. Exercise that causes damage to these contractile proteins, such as resistance training of sufficient load carried out through an adequate range of motion, stimulates hypertrophy of the muscle by recruiting satellite cells to the damaged area(s). Evans 2002 Bazgir 2017 These satellite cells, which can be thought of as muscle stem cells, help regenerate damaged fibers and are ultimately incorporated into the damaged myofibrils as new myonuclei, where they can participate in muscle protein synthesis and repair processes. Ultimately, this helps the muscle fiber grow larger and return to normal function.
Training Volume – In resistance training volume can be defined as the total amount of reps performed, e.g. the product of sets and reps. In general, muscular hypertrophy has been shown to have a dose-dependent relationship with training volume.Schoenfeld 2019 In other words, higher doses of training volume tend to result in greater amounts of hypertrophy, to a point. Based on the factors described so far, this shouldn’t be surprising, as more volume requires the muscles undergo more loading, more motor unit recruitment, and more metabolic stress. There is a caveat however, as the amount of total training stress must be tolerable by the individual so as not to outstrip their recovery resources. This is shown in research where the majority of hypertrophy occurs after the first 4-6 weeks, rather than earlier on in untrained individuals. Damas 2015 DeFreitas 2011 Green 1999
Thus, in order for an exercise to be a viable candidate for promoting hypertrophy, it should mechanically load the desired muscle group(s), use a relatively large range of motion through both concentric and eccentric contractions, and tolerate higher exercise volumes performed to near failure.
Coaching Theory
From a coaching perspective, the exercises selected should maximize both adherence to the program and fitness adaptations while minimizing the risk of injury. As mentioned in the introduction, adherence is likely improved by self-selected exercise type, though there is also evidence for improved adherence with self-selected intensity, i.e. the load in resistance training or the pace in aerobic exercise. Baz-Valle 2019 Williams 2008 An additional well-known component for long-term behavioral change is to try and build a person’s self-efficacy, e.g. an individual’s belief in their ability to do something through perseverance and determination. Neupert 2009
So, there is a case to be made for the individual to play an active role in picking the appropriate exercises, which should be guided by their coach, if present, to help reach their goals. With respect to resistance training, these goals should center around improving strength and increasing muscle mass in all major muscle groups over the lifetime of the individual. The function of a coach is to determine the appropriate constraints for exercise selection based on the individual’s training history, preferences, goals, and available resources.
We can combine our criteria from the discussions on adherence, exercise variation, and training outcomes to develop a general model for exercise selection:
- The totality of the exercises included in a program should load all major muscle groups of the body.
- The range of motion for included exercises should be relatively large when possible.
- Exercises should allow for increases in training volume over time, which may vary based on the individual.
- Exercises should allow for a wide variety of different loading protocols that allow the individual to get near failure in different repetition ranges.
- Exercises should be selected based on existing resources such as training time and equipment availability.
- For strength, exercises should be relatively specific to the test with respect to movement and bioenergetic characteristics, but also include related variations.
- The individual’s preferences for certain exercises should be taken into account whenever possible.
Based on what has currently been presented in this review, we can see how exercise selection can impact training outcomes and adherence. However, when it comes down to selecting between two closely-related exercises, e.g. ones that use similar muscle groups, share a similar range of motion, are equally preferred by the trainee, and that can be performed using the same programming parameters, how do we make the right choice? Does this change if one variation is significantly lighter than the other and the goal is strength? How about hypertrophy?
An example may be illustrative. Let’s say we took identical twins and put them on the same training program, with the sole exception being that one did front squats and one did low bar back squats, who would have a higher leg press 1RM at the end of 1 year? How about overall leg muscle cross sectional area?
For the rest of the article, we’ll use the paper by Yavuz et al. to try and answer this question. This paper uses surface electromyography (sEMG) to measure muscle excitation to measure what the muscles are doing during both 1RM front squats and back squats. This is a type of surrogate endpoint, e.g. a measurement of a variable that may or may not correlate with an important outcome, muscle hypertrophy and strength in this case.
In medicine, surrogate endpoints are often utilized to assess difficult-to-measure outcomes, e.g. one that may take months or years to occur. For example, blood pressure and serum lipoprotein levels (e.g. LDL) are used as surrogate endpoints for heart disease, which has a rather long latency period.
In any case, we’ll need to have a better understanding of this research tool in order to understand the study, so bear with me as we briefly review sEMG.
Exercise Testing
The 12 participants turned up to the lab twice during this experiment. The first visit was used to provide the subjects an overview of the study , give them a chance to ask questions, and, apparently, max out on their front and back squats. Unfortunately, not a lot of data on the subjects included in the study was reported by the researchers. We know that they used 12 healthy males who had some experience performing front and back squats. The participants reportedly had no injury history, but that’s about all we know. Nothing about age, bodyweight, height, training history, or any other information is included in the article.
Surface EMG
As mentioned above, sEMG is an experimental technique concerned with the development, recording and analysis of electrical signals in the muscle tissue, which is measured by surface electrodes. At its core, sEMG is a juiced-up voltmeter that detects increases and decreases in voltage of the muscle fiber’s membrane, which always precede the contraction of a muscle.
Mechanistically, sEMG detects electrical changes that occur secondary to the flow of ions across the muscle fiber’s semi-permeable membrane using electrodes stuck to the surface of the test subject. When a muscle fiber receives a big enough signal from the nerve that innervates it, there is a rapid change in ionic flow that increases the voltage of the muscle fiber, aptly named, depolarization. At rest, a muscle shows no significant EMG activity, as there’s not enough ionic flow across its membrane to trigger muscle excitation, the increase in voltage in the muscle fiber that occurs secondary to the nerve signal.
It is important to note that muscle excitation and muscle activation are not the same thing. Muscle activation, which is measured from 0% (all fibers inactive) to 100% (all fibers active), occurs secondary to muscle excitation, but takes into account additional inputs such as the delay between nerve signal and mechanical contraction, ion kinetics, etc. Rather, muscle excitation is just the increase in voltage, the depolarization, of the muscle fibers being measured by surface electrodes. Zatsiorsky 2012 Despite these limitations, the primary determinant of the amplitude of the sEMG signal is motor unit recruitment. In general, the bigger the sEMG amplitude, the more motor unit recruitment, though we should be careful to only describe sEMG findings as muscle excitation. Dankel 2017 Vigotsky 2018
With respect to methodology, sEMG is pretty straightforward:
- Hair removal- This improves the adhesion of the electrodes, especially during movement and/or when people sweat.
- Clean the skin- This is done with either fine sand paper, rubbing alcohol, or special abrasive cleaning pastes to remove dead skin cells, dirt, and debris from the skin.
- Gel- A gel is applied between the electrode and the skin for more reliable voltage readings.
- Electrode placement- The standard procedure is to place the electrode in the middle of the muscle belly of interest based with at least a 2-cm gap between electrodes to avoid electrical cross-talk between the electrodes.
As a surrogate outcome, sEMG data is used to make inferences on the clinical outcomes, strength and hypertrophy. For example, it is assumed that the data is not entirely clear. For a full discussion of this, I’d recommend reading Dr. Vigotsky’s 2017 article, Interpreting Signal Amplitudes in Surface Electromyography Studies in Sport and Rehabilitation Sciences, which is cited above. For the sake of this article however, I’ll briefly review some of the findings here.
With respect to sEMG and hypertrophy, the assumption is that the greater sEMG amplitude, the more motor unit recruitment via excitation, which drives more muscle growth.
On the negative side, a 2015 study by Jenkins et al looked at the sEMG amplitude in 9 women and 9 men doing leg extensions under two different conditions. The first condition was where individuals did 3 sets of 80% 1RM to failure and the second condition, performed one week later, was 3 sets of 30% 1RM to failure. sEMG was higher when using 80% compared to 30%. Jenkins 2015 Remember however, the overwhelming evidence suggests there’s no difference in hypertrophy outcomes between low-load or high-load resistance training, provided sets are taken close to failure. Schoenfeld 2017 This suggests that sEMG amplitude may not be a useful surrogate for muscular hypertrophy when exercises are performed to failure.
On the other hand, there’s some evidence suggesting that sEMG amplitude may be useful at predicting hypertrophy outcomes when comparing different exercises. For example, sEMG amplitude in the rectus femoris, a quadriceps muscle, is much higher during leg extensions, a single-joint exercise, than in leg press, a multi-joint exercise. Ema 2016 Thus, we would predict that a single-joint exercise might produce more quadriceps hypertrophy than a multi-joint exercise, which is supported by separate data showing single-joint exercises are effective for rectus femoris hypertrophy, while multi-joint exercises are not. Ema 2013 Fonseca 2014
With respect to sEMG and strength, the assumption is that the greater the sEMG amplitude, the more force production is happening, which drives more strength acquisition.
What does the data say, you ask? In 2015, a Danish research group had 30 college students do either band-resisted push-ups or a bench press for 5 sets of 6 reps twice per week for 5 weeks. A 6RM load was determined during the pretest to the study, and was kept constant the whole time. Yep, these folks did 5 sets of 6 with a “6RM” twice weekly for 5 weeks. In any case, both exercises generated the same sEMG of the pectoralis major and anterior deltoid. Additionally, both groups saw similar increases in the 1RM and 6RM bench press performance. Calatayud 2015
That said, there’s not a lot of other evidence supporting these findings. While it is plausible that similar loads for relatively similar movements with respect to contraction type, joint angles, movement velocity, etc. produce, the connection between sEMG amplitude and strength probably needs more research before it is well established. Vigotsky 2018
Overall, sEMG is a useful tool for establishing muscle excitation during exercises. Though the jury is still out on using it as a surrogate marker, it does seem reasonable to suggest that without large differences in sEMG activity in the same muscle groups in two different exercises, we probably shouldn’t expect large differences in hypertrophy and strength outcomes.
In the Yavuz study, the sEMG electrodes were placed on the following locations:
- Quadriceps: rectus femoris, vastus medialis, and vastus lateralis
- Posterior chain: erector spinae, and gluteus maximus
- Hamstrings: biceps femoris, and semitendinosus
The EMG system was synchronized with a camera recording in slow motion, e.g. ~ 120 frames per second. The participants wore reflective markers over the lateral aspect of their right ankle, right knee, and right hip. An additional reflective marker was placed on the end of the barbell. This allowed the researchers to address kinematic differences such as joint angles between the two different exercises using two-dimensional kinematical analysis software.
Maximum Voluntary Isometric Contraction Test
The maximum voluntary isometric contraction (MVIC) test is used to try and interpret the muscle activation, e.g. 0% (no fibers active) to 100% (all fibers active), recorded during an exercise. To do this, the researchers test each investigated muscle separately in a single-joint exercise, e.g. the a maximal isometric leg extension to test the MVIC for various quadriceps muscles.
The idea here is that by comparing the sEMG activity during MVIC to that seen during the exercise(s) under investigation, the researchers can ballpark how active a muscle actually is. That said, we know that muscle force production is specific to the testing parameters, e.g. muscle length, contraction type and velocity, contraction history, etc.
All that to say, the activation numbers are unlikely to be accurate, in that a 50% value is unlikely to really represent 50% of a muscle’s fibers being active. However, the numbers are likely to be fairly precise in that they represent a way to scale the sEMG data. Vigotsky 2018 In other words, 50% is more than 30%, which may have implications for programming.
1RM Squat Test
After all this, the subjects tested their 1RM back squat and front squat, though it’s unclear which exercise they did first. To arrive at their 1RM, the subjects first performed a 3-5 min general warm-up on an exercise bike, then did the following:
- 8-10 repetitions at 50% of their 1RM (established the previous week)
- 3-5 repetitions at 75% of 1RM
- 3 repetitions at 90% of 1RM
- Complete successively greater loads until failure
Of note, the subjects rested 3-5 minutes between sets. The depth of the squats was measured as a “knee angle of 90*”, though it’s unclear as to what they’re measuring 90* against. The authors mentioned that the bottom of the squat was, “marked by adjustable stoppers.”
Based on the picture of the testing procedures below (Figure 1), my interpretation is that the researchers set the safeties up to a point where the participants squatted above parallel. From there, they either did a pin squat, completing a squat from the safeties, or the safeties were just below the desired depth. Again, it’s unclear, but I’m guessing they didn’t actually do a pin squat at RPE 10.
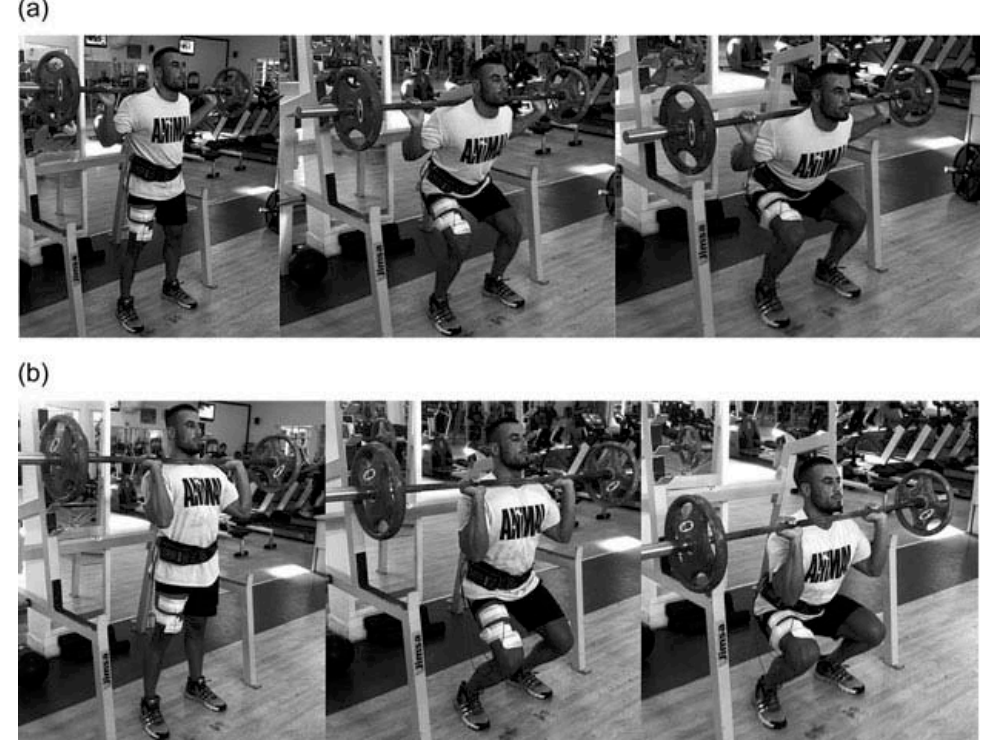
Figure 1: Top sequence- bar positioning, depth, etc. in the back squat. Bottom sequence- bar positioning, depth, etc. in the front squat. Extra points for the Animal™ t-shirt.
Findings
1RM Squat Test
On average, the subjects had 1RM’s of 109.17 ± 25.51 kg and 85.00 ± 15.67 kg for the back and front squats, respectively. While the authors did not report the subjects’ bodyweight, they did note that the participants could lift an average of 138% and 105% of their body weight for back and front squat, respectively. This puts the bodyweight of the participants right around 79kg.
sEMG Amplitude
The only statistically significant difference in sEMG amplitude between back and front squats was seen in the vastus medialis, the most medial muscle of the quadriceps. Specifically, the front squat showed an average of 55.4% activation through the entire movement, whereas the back squat showed an average of 48.8%. As a reminder, these percentages compare the sEMG amplitude measured during the movement to the sEMG amplitudes recorded during MVIC tests.
Of note, there were no other statistically significant differences in muscle activation in any other muscle groups including the erector spinae, gluteus maximus, and hamstring muscles, e.g. the semitendinosus and biceps femoris.
Joint Kinematics
Two-dimensional kinematic analysis showed a statistically significant difference in hip angle, e.g. the angle of the torso relative to the femur. The front squat had an average hip angle of 95.89 degrees, whereas the back squat averaged 79.46 degrees. In other words, the front squat had a more vertical torso relative to the floor, whereas the back squat had a more horizontal torso angle.
No other statistically significant differences in measured joint angles were observed in this study.
Takeaways
Overall, this study suggests that the only significant difference in muscle excitation and activation between front and back squats is seen in the vastus medialis, with the front squat having slightly higher activation levels than the back squat. Additionally, the only measured movement difference between the back squat and front squat appears to be a more upright torso angle in the front squat. Save for those two findings, the front squat and the high bar back squat performed to ~ 90* of knee flexion appear nearly identical.
My quibbles with this study include the lack of raw anthropometric and performance data on participants, as I’d like to know their age and training history at a bare minimum. I’d also like to see the individual 1RM, MVIC, and sEMG results to see how they correlated, if at all. Finally, I do think that the squat depth being above parallel likely affected the joint kinematics, as we’d expect some greater differences in knee and hip angles, and possible sEMG between the two squats if they were taken deeper.
The clinical significance of the sEMG finding with respect to hypertrophy is unclear. At present, we don’t really know if relatively small differences in sEMG reliably correlate to substantially different muscle hypertrophy outcomes. Rather, the data suggests that large differences in sEMG amplitudes between exercises- like the differences between rectus femoris sEMG during leg extensions and leg press- may produce a difference in hypertrophy outcomes. Ema 2013 Fonseca 2014 Ema 2016 At present, it seems unlikely that there’s a significant, reliable difference in hypertrophy outcomes from exercises with similar sEMG amplitudes.
With respect to strength, these findings suggest that both types of squats have approximately the same potential for improving strength performance when tested using the same type of squat. In other words, we would assume that front squats are best for improving front squat strength performance, while high bar back squats are best for improving high bar back squat strength performance. Given the similarities between the two in joint angles, we’d also expect a high degree of transference or carry over from high bar back squat to the front squat and vice versa.
For less specific strength assessments, e.g. tests that aren’t back or front squats, the sEMG data suggests that both types of squats are equivalent for increasing force production capacity in the trunk and leg muscles. Interestingly, this appears to be true despite the front squat using substantially lighter loads. In other words, it doesn’t really matter what the absolute load being lifted is, but rather how hard the muscles are working.
This sentiment is supported by more sEMG evidence showing that leg and trunk muscles are equally active in the front squat as they are in the back squat. Gullett 2009 Additionally, the overwhelming majority studies have shown similar- or even better- strength outcomes when using moderate intensities rather than high intensities. Carpinelli 2008 Jungblut 2009
To be clear, it doesn’t appear that using heavier weights with a specific exercise reliably drive greater strength improvements than moderate weights, provided both efforts are challenging to the individual. Additionally, selecting an exercise that allows heavier loads to be lifted over a similar ROM and movement pattern don’t necessarily make the muscles any stronger outside of the specific movement. In other words, the greater load lifted in a back squat over a front squat doesn’t make the muscles any stronger, e.g. capable of producing more force, outside of the back squat.
With all this in mind, let’s return to our twins- one front squatting and one low bar back squatting. Who do you think will have the higher leg press 1RM and leg muscle cross sectional at the end of 1 year? Based on what has been presented so far, there is unlikely to be any significant difference in strength or hypertrophy outcomes between the twins. Thus, a good coach would allow personal preference to dictate exercise selection, perhaps even advocating for both (or more) variations in order to avoid early specialization.
In the grand scheme of things, exercise selection is an important programming variable for both performance and health outcomes and a good coach will work with their trainee to make the appropriate selection.
Thanks to Drs. Austin Baraki, Derek Miles, and Michael Ray for editing and reviewing this article.
References:
Westcott, W. L., Winett, R. A., Annesi, J. J., Wojcik, J. R., Anderson, E. S., & Madden, P. J. (2009). Prescribing Physical Activity: Applying the ACSM Protocols for Exercise Type, Intensity, and Duration Across 3 Training Frequencies. The Physician and Sportsmedicine, 37(2), 51–58. doi:10.3810/psm.2009.06.1709
Baz-Valle E, Schoenfeld BJ, Torres-Unda J, Santos-Concejero J, Balsalobre-Fernández C. The effects of exercise variation in muscle thickness, maximal strength and motivation in resistance trained men. PLoS One. 2019;14(12):e0226989. Published 2019 Dec 27. doi:10.1371/journal.pone.0226989
Williams, D. M. (2008). Exercise, Affect, and Adherence: An Integrated Model and a Case for Self-Paced Exercise. Journal of Sport and Exercise Psychology, 30(5), 471–496. doi:10.1123/jsep.30.5.471
Wu HG, Miyamoto YR, Gonzalez Castro LN, Ölveczky BP, Smith MA. Temporal structure of motor variability is dynamically regulated and predicts motor learning ability. Nat Neurosci. 2014;17(2):312‐321. doi:10.1038/nn.3616
Dhawale AK, Smith MA, Ölveczky BP. The Role of Variability in Motor Learning. Annu Rev Neurosci. 2017;40:479‐498. doi:10.1146/annurev-neuro-072116-031548
Post EG, Trigsted SM, Riekena JW, et al. The Association of Sport Specialization and Training Volume With Injury History in Youth Athletes. Am J Sports Med. 2017;45(6):1405‐1412. doi:10.1177/0363546517690848
Bell DR, Post EG, Biese K, Bay C, Valovich McLeod T. Sport Specialization and Risk of Overuse Injuries: A Systematic Review With Meta-analysis. Pediatrics. 2018;142(3):e20180657. doi:10.1542/peds.2018-0657
Fonseca RM, Roschel H, Tricoli V, et al. Changes in exercises are more effective than in loading schemes to improve muscle strength. J Strength Cond Res. 2014;28(11):3085‐3092. doi:10.1519/JSC.0000000000000539
Vigotsky AD, Halperin I, Lehman GJ, Trajano GS, Vieira TM. Interpreting Signal Amplitudes in Surface Electromyography Studies in Sport and Rehabilitation Sciences. Front Physiol. 2018;8:985. Published 2018 Jan 4. doi:10.3389/fphys.2017.00985
Neupert SD, Lachman ME, Whitbourne SB. Exercise self-efficacy and control beliefs: effects on exercise behavior after an exercise intervention for older adults. J Aging Phys Act. 2009;17(1):1‐16. doi:10.1123/japa.17.1.1
Reilly, Thomas & Morris-Paterson, Tess & Whyte, Greg. (2009). The specificity of training prescription and physiological assessment: A review. Journal of sports sciences. 27. 575-89. 10.1080/02640410902729741.
Herzog, W. (2004). History dependence of skeletal muscle force production: Implications for movement control. Human Movement Science, 23(5), 591–604. doi:10.1016/j.humov.2004.10.003
Potvin, J. R., & Fuglevand, A. J. (2017). A motor unit-based model of muscle fatigue. PLOS Computational Biology, 13(6), e1005581. doi:10.1371/journal.pcbi.1005581
van den Tillaar R, Andersen V, Saeterbakken AH. Comparison of muscle activation and kinematics during free-weight back squats with different loads. PLoS One. 2019;14(5):e0217044. Published 2019 May 16. doi:10.1371/journal.pone.0217044
Jones, E. J., Bishop, P. A., Woods, A. K., & Green, J. M. (2008). Cross-Sectional Area and Muscular Strength. Sports Medicine, 38(12), 987–994. doi:10.2165/00007256-200838120-00003
Simpson CL, Kim BDH, Bourcet MR, Jones GR, Jakobi JM. Stretch training induces unequal adaptation in muscle fascicles and thickness in medial and lateral gastrocnemii. Scand J Med Sci Sports. 2017;27(12):1597‐1604. doi:10.1111/sms.1282
Schoenfeld BJ. The mechanisms of muscle hypertrophy and their application to resistance training. J Strength Cond Res. 2010;24(10):2857‐2872. doi:10.1519/JSC.0b013e3181e840f3
Schoenfeld BJ, Grgic J, Ogborn D, Krieger JW. Strength and Hypertrophy Adaptations Between Low- vs. High-Load Resistance Training: A Systematic Review and Meta-analysis. J Strength Cond Res. 2017;31(12):3508‐3523. doi:10.1519/JSC.0000000000002200
Newmire DE, Willoughby DS. Partial Compared with Full Range of Motion Resistance Training for Muscle Hypertrophy: A Brief Review and an Identification of Potential Mechanisms. J Strength Cond Res. 2018;32(9):2652‐2664. doi:10.1519/JSC.0000000000002723
McMahon, G.E., Onambele-Pearson, G.L., Morse, C.I., Burden, A.M., & Winwood, K. (2013). How deep should you squat to maximise a holistic training response? Electromyographic, energetic, cardiovascular, hypertrophic and mechanical evidence.
Evans WJ. Effects of exercise on senescent muscle. Clin Orthop Relat Res. 2002;(403 Suppl):S211‐S220. doi:10.1097/00003086-200210001-00025
Smith RC, Rutherford OM. The role of metabolites in strength training. I. A comparison of eccentric and concentric contractions. Eur J Appl Physiol Occup Physiol. 1995;71(4):332‐336. doi:10.1007/BF00240413
Bazgir B, Fathi R, Rezazadeh Valojerdi M, Mozdziak P, Asgari A. Satellite Cells Contribution to Exercise Mediated Muscle Hypertrophy and Repair. Cell J. 2017;18(4):473–484. doi:10.22074/cellj.2016.4714
Evans, WJ. Effects of exercise on senescent muscle. Clin Orthopaed Rel Res 403(Suppl.): S211–S220, 2002.
Schoenfeld BJ, Contreras B, Krieger J, et al. Resistance Training Volume Enhances Muscle Hypertrophy but Not Strength in Trained Men. Med Sci Sports Exerc. 2019;51(1):94–103. doi:10.1249/MSS.0000000000001764
Damas F, Phillips SM, Lixandrao ME, Vechin FC, Libardi CA, Roschel H, Tricoli V, Ugrinowitsch C (2015) Early resistance training-induced increases in muscle cross-sectional area are concomitant with edema-induced muscle swelling. Eur J Appl Physiol.
DeFreitas JM, Beck TW, Stock MS, Dillon MA, Kasishke PR 2nd (2011) An examination of the time course of training-induced skeletal muscle hypertrophy. Eur J Appl Physiol 111(11):2785– 2790.
Vila-Chã C, Falla D, Farina D. Motor unit behavior during submaximal contractions following six weeks of either endurance or strength training. J Appl Physiol (1985). 2010;109(5):1455‐1466. doi:10.1152/japplphysiol.01213.2009
Zatsiorsky V. M., Prilutsky B. I. (2012). Biomechanics of Skeletal Muscles. Champaign, IL: Human Kinetics
Dankel SJ, Mattocks KT, Jessee MB, Buckner SL, Mouser JG, Loenneke JP. Do metabolites that are produced during resistance exercise enhance muscle hypertrophy?. Eur J Appl Physiol. 2017;117(11):2125‐2135. doi:10.1007/s00421-017-3690-1
Ema R, Sakaguchi M, Akagi R, Kawakami Y. Unique activation of the quadriceps femoris during single- and multi-joint exercises. Eur J Appl Physiol. 2016;116(5):1031‐1041. doi:10.1007/s00421-016-3363-5
Ema R, Wakahara T, Miyamoto N, Kanehisa H, Kawakami Y. Inhomogeneous architectural changes of the quadriceps femoris induced by resistance training. Eur J Appl Physiol. 2013;113(11):2691‐2703. doi:10.1007/s00421-013-2700-1
Calatayud J, Borreani S, Colado JC, Martin F, Tella V, Andersen LL. Bench press and push-up at comparable levels of muscle activity results in similar strength gains. J Strength Cond Res. 2015;29(1):246‐253. doi:10.1519/JSC.0000000000000589
Gullett, J. C., Tillman, M. D., Gutierrez, G. M., & Chow, J. W. (2009). A biomechanical comparison of back and front squats in healthy trained individuals. Journal of Strength and Conditioning Research, 23, 284–292.
Carpinelli, R. N. (2008). The size principle and a critical analysis of the unsubstantiated heavier-is-better recommendation for resistance training. Journal of Exercise Science and Fitness, 6, 67–86.
Jungblut, Sandee. (2009). The Correct Interpretation of the Size Principle and Its Practical Application to Resistance Training. Medicina Sportiva. 13. 203-209. 10.2478/v10036-009-0033-2.