Meat is an important dietary component for much of the world, whereas the prevalence of veganism or vegetarianism varies widely in different countries. For example, India has the highest proportion of vegetarians at ~30% of the population, whereas only 5% and 2% of Americans are vegetarians or vegans, respectively. Going “meatless” is also on the rise in developed countries, as two US-based surveys in 2012 and 2015 suggest that 30-40% of Americans reported eating less meat than they did three years earlier. Barclay 2016 Reuters 2012 Recent estimates suggest that approximately 6.4% of the global population consumes a vegetarian diet, which means that about 7.2 billion individuals consume meat as part of their typical diet. Wikipedia 2019
Check the podcast above for a discussion with Alan Flanagan on this topic. If you’re short on time, we recommend checking out the take home message at the bottom of this article and then circling back to read this article when you can.
The consumption of “red” meat and its effect on health is a controversial topic, with no shortage of scientific articles on both sides of the argument. Adding fuel to the fire, a recent article published in the Annals of Internal Medicine suggested that:
“…the desirable effects (a potential lowered risk for cancer and cardiometabolic outcomes) associated with reducing meat consumption probably do not outweigh the undesirable effects (impact on quality of life, burden of modifying cultural and personal meal preparation and eating habits.”
The authors go on to conclude:
“The panel suggests that adults continue current unprocessed red meat consumption (weak recommendation, low-certainty evidence). Similarly, the panel suggests adults continue current processed meat consumption (weak recommendation, low-certainty evidence).”Johnston 2019
These “recommendations” stand in contrast to multiple national and international health organizations. For example, the 2015–2020 Dietary Guidelines for Americans recommend limiting red meat intake to about 1 serving per week 2015-2020 Dietary Guidelines. Additionally, the World Cancer Research Fund (WCRF) recommends that individuals consume no more than 3 portions per week of unprocessed red meat and little, if any, processed red meat. WCRF 2018 This works out to approximately 350-500 grams (12-18 ounces) of cooked red meat per week.
Additionally, the UK’s National Health Service (NHS) agrees with the WCRF and advises that people should limit consumption of all red meat to 490 grams per week.NHS 2018 Finally, the American Heart Association (AHA) recommends limiting red meat intake – particularly cuts containing high amounts of saturated fat – although they do not give strict recommendations, reporting that “Research shows that the majority of consumers prefer nutrition education about what to eat rather than what not to eat.” Eckel 2013 Matthews 2011
In reality, the red meat controversy runs much deeper than this, with hundreds – if not thousands – of editorials, research reviews, and other publications making a case for why you should (or shouldn’t) alter your dietary pattern. In this article, we’ll take a deep dive into this contentious issue and attempt to provide some practical take-home points.
Red Meat: More Than Just Beef
Red meat comes in two major varieties: unprocessed and processed. “Unprocessed” red meat includes fresh beef, veal, pork, lamb, mutton, horse, goat, or offal (internal organs), whereas “processed” meat has been transformed via salting, curing, fermentation, smoking or another process to improve flavor or preservation. Monteiro 2016 Red meat consumption per person is calculated by taking the total amount of red meat produced and imported nationally, less the exported red meat, and then dividing this number by the total number of individuals in the population. IARC 2018 These calculations suggest that on average, individuals in North America and Europe consume about 2-4 servings per week of red meat, or about 70 grams per day. Daniel 2011 2015 Canadian Health Survey Micha 2014 NDNS 2014
It should be pointed out that these numbers underestimate actual red meat consumption because not all individuals in a population eat meat. Additionally, if the average person in these regions is consuming 70 grams of red meat per day (490 grams per week), then this level of intake falls within the WRCF-recommended ~350-500 grams or 12-18 ounces of cooked red meat per week. WCRF 2018 In other words, if we wanted to see whether high levels of red meat intake had negative health consequences, we should study those consuming amounts of red meat in excess of the current guidelines.
The two major rubs against high red meat intake are due to evidence suggesting an increase in the risk of cancer and heart disease. So we’ll need to unpack these ideas a bit more in order to understand why the current guidelines exist, and why these new recommendations are so controversial.
Cancer Risk
Health experts have weighed in on what we should eat for nearly 40 years, but only recently have national and international organizations made specific recommendations with respect to red meat intake.
For example, in 2011 the first iteration of the Continuous Update Project – a database containing all relevant papers regarding cancers – was published by the WCRF and American Institute for Cancer Research (AICR). It is continually updated with new data and revised when appropriate. As of 2018, the database contains ~10,000 publications relating to cancer, which ultimately helped form the WRCF/AICR Cancer Prevention Recommendations.
These recommendations cover specific dietary, physical activity, and weight management targets for cancer prevention. Overall, current evidence suggests that following these recommendations is associated with a reduced risk of cancer and cancer-related death. For instance, a review of the 386,355 subjects participating in the European Prospective Investigation into Cancer and Nutrition (EPIC) study found that, “Adherence to the WCRF/AICR recommendations for cancer prevention may lower the risk of developing most types of cancer.” Romaguera 2012
Additionally, another group of researchers looking at the same subjects found that those with the highest levels of adherence to these recommendations experienced reduced all-cause and cancer-related mortality risk in addition to reduced mortality from circulatory and respiratory causes. Vergnaud 2013 Even the Annals of Internal Medicine paper we started this article with found that diets low in red and processed meats were associated with both a 10% reduction in cancer incidence and 11% reduction in cancer mortality. Johnston 2019
Additionally, the World Health Organization (WHO) commissioned 22 researchers to form the International Agency for Research on Cancer (IARC). Subsequently, this group reviewed 800 studies that looked at the associations of more than 12 types of cancer and red meat or processed meat intake. After the data review was completed, the WRCF/AICR and IARC found that high levels of red meat consumption were associated with increased risks of colorectal, pancreatic, and prostate cancers. However, the evidence was insufficient to draw confident conclusions about red meat intake and cancers of the esophagus, breast, stomach, liver, thyroid, testes, kidney, bladder, ovary, endometrium, brain, and blood cancers. IARC 2015
The most compelling data on the topic pertain to high levels of red meat intake and colorectal cancers, which we’ll examine more closely. If you’d like to read the IARC’s review of these studies or pull the individual papers for yourself, check out the IARC Monograph Volume 114, section 2.2.
Studying Studies
To begin, all of the studies finding a relationship between red meat intake and colorectal cancer are observational in nature. Observational studies look at the effect(s) of a particular risk factor, test, or intervention without manipulating who is or isn’t exposed to it. In contrast, experimental studies use specific eligibility criteria to determine the subjects who are exposed to a specific intervention in order to study its effects, typically compared to a control group. In experimental studies, the subjects are typically randomized, or separated into groups by chance.
Cohort and case-control studies are two types of observational studies, whereas the randomized controlled trial (RCT) is a type of experimental study. In a cohort study, researchers look at what happens to a group of people who share a common link, e.g. a cohort, who are exposed to a particular variable compared to those who are also in that group, but who aren’t exposed to that variable. For example, the NYU Women’s Health Study enrolled a group of 14,727 women aged 34-65 who went to participating mammography clinics. The researchers then looked at how much red meat they consumed to see if it correlated with the development of colorectal cancer. Kato 1997 The common links forming the cohort were women of a particular age group at these specific clinics.
In a case-control study, researchers find people with existing health conditions (e.g. cases) and a similar group of folks without the condition (e.g. controls) and try to compare the two groups in terms of exposure(s) to particular risk factors, tests, or interventions. For example, a UK-based research group identified individuals with 579 total cases of colorectal cancer and matched them with 1,996 controls based on age, sex, and recruitment date. From here, the researchers tried to determine if red meat intake was associated with colorectal cancer risk. Spencer 2010
Cohort studies can be advantageous in nutritional epidemiology, as they can show a temporal relationship between exposure and disease. In lay terms, because the nutritional questionnaires were collected prior to disease development in these studies, the risk of recall bias – those diagnosed with colorectal cancer over or under reporting their red meat intake and reverse causation, e.g. colorectal cancer causing elevated red meat intake. Case-control studies can also be advantageous for diseases that take a long time to develop such as cancer and heart disease.
On the flip side, observational studies are limited in their ability to determine causation due to the large number of variables that can confound the data. In other words, there may be factors that unmeasured and uncontrolled that are actually the cause of the relationship between a variable like red meat intake and a particular outcome such as cancer or heart disease. Stronger relationships between the variable and the outcome tend to lower the chance of a confounder, however complex health conditions like cancer and heart disease have many different risk factors that increase the risk of a confounding variable.
With that in mind, observational data tend to get a bad rap when studying how nutrition impacts disease risk. Part of this comes from the idea that randomized controlled trials (RCT’s) are the “gold-standard” when it comes to scientific inquiry. This issue was discussed at length by Alan Flanagan in a four part series available here, here, here, and here. To summarize, the relationship between nutrition and most diseases needs to be assessed over a long period of time due to the long latency period for complex diseases like cancer and heart disease. This makes RCTs an impractical – and often impossible – choice for this. But for now, let’s turn back to the meat issue and see if we can make some sense of it.
Trimming the Fat Off Meat and Cancer Data
In the controversial recommendations that prompted this article, we see the RCT gold-standard issue play out in the authors’ conclusions:
“…we suggest that individuals continue their current consumption of both unprocessed red meat and processed meat (both weak recommendations, low-certainty evidence).” (bold added for emphasis)
To support the rationale for rating the evidence as low certainty, the authors further comment:
“As noted in our introduction, other dietary guidelines and position statements suggest limiting consumption of red and processed meat because of the reported association with cancer… Other guidelines have not used the GRADE approach for rating certainty of evidence that highlight the low or very low certainty of evidence to support the potential causal nature of the association between meat consumption and health outcomes.” (bold added for emphasis)
GRADE stands for Grading of Recommendations, Assessment, Development, and Evaluation. The GRADE system was developed in the early 2000’s to help provide clear and uniform information about strength and certainty of what the scientific evidence says about a certain intervention, e.g. a medication, and its effect on an outcome, e.g. a disease. While it was originally designed for pharmaceutical trials, it has been applied to other aspects of medical research where systematic reviews are performed.
In the GRADE system, the certainty of evidence is initially separated into either high or low certainty evidence depending on the types of studies available for review. If most of the included studies are randomized trials, the evidence is initially set to be “high”. If most of the studies are observational, however, the evidence is initially set to be “low”. Guyatt 2008 Five further criteria are then used to upgrade or downgrade the certainty of evidence:
- Risk of Bias
- Inconsistency of results between studies
- Indirectness of evidence
- Imprecision
- Publication Bias
When looking at the actual studies that underpin the current red meat recommendations from the US, UK, WCRF, and AICR we see that nearly all of them are observational in nature, which automatically classifies them as low-certainty when applying the GRADE system. Given the issues with using RCTs for studying the effect of diet on diseases with long latency periods, e.g. cancer and heart disease, this automatic low-certainty rating may be inappropriate given the unique nature of nutritional research. So, we should take a closer look at the actual data to see if there are multiple converging lines of evidence, i.e. consistent effects across populations in multiple studies as well as mechanistic data, supporting the current red meat recommendations.
At present, 7 of 14 cohort studies and 7 of 15 case control studies finding positive associations for red meat and colorectal cancer, and 12 of 18 cohort studies and 6 of 9 case-control studies finding an association for processed meat and colorectal cancer. IARC 2015 From a mechanistic perspective, there are data implicating the following 4 compounds in cancer in both animal and human studies:
- Heme Iron – iron contained in meat, which gives meat its red color.
- Heterocyclic amines (HCA) – formed when amino acids in meat react with high temperatures.
- Polycyclic aromatic hydrocarbons (PAH) – smoke contains PAHs that adhere to surface of meat during cooking.
- N-nitroso– compounds – found in foods (including meat) cured with sodium nitrite or similar curing compounds.
Overall, 11 meta-analyses of 213 studies suggest that increased consumption of red and processed meat increases colorectal cancer risk by 20-30%. Aykan 2015 The IARC goes on to report that for every 100 grams of red meat eaten per day, the relative risk of colorectal cancer increases by ~17%, whereas just a 50 gram increase in processed red meat intake is associated with an 18% higher relative risk of colorectal cancer. IARC 2015
It should be noted that these are relative risk values, or how much an individual’s existing risk is changed relative to their baseline risk. In contrast, absolute risk tells us the number of cases of cancer would be seen in a particular group by increasing red meat intake. Confused? Let’s put some numbers in here to provide some insight.
Based on current data, there will be ~135,430 new cases of colorectal cancer diagnosed in the US, which connotes an approximately 4.5% lifetime risk. Siegel 2016 This works out to be about 39 new cases per 100,000 people. If a group of 100,000 individuals increases their red meat intake by 100 grams per day or processed red meat intake by 50 grams per day, we’d expect to see an additional ~7 cases, for a total of 46.
Is this a big deal? From a population level, this could be a big deal if everyone decided to start eating dramatically more meat. However, given that the average red meat intake does fall within the WCRF/AICR and UK-recommended ranges, I’m not sure we should be focusing a lot of effort and resources at reducing red meat intake at the population level from a cancer perspective compared to other interventions with larger effects.
On the other hand, the calculus likely changes for individuals consuming very high amounts of red meat and/or processed meats. Based on present evidence, it doesn’t seem particularly wise to suggest that individuals should consume as much red meat or processed meat as they want to. But for now let’s hold off on making any additional recommendations until we address the other elephant in the room: heart disease.
Heart Disease
The connection between diet and “heart disease” is based upon two hypotheses; 1) the diet-heart hypothesis and, 2) the lipid hypothesis. The diet-heart hypothesis argues that reducing dietary saturated fat will reduce serum cholesterol levels, thus slowing the build up of fats, cholesterol, and other substances in blood vessel walls, e.g. atherosclerosis. Ramsden 2016 The lipid hypothesis takes this a step further and predicts that lowering serum cholesterol levels will reduce the incidence of heart disease, though this is actually a misnomer. Brown 1990 Atherosclerotic Cardiovascular Disease or “ASCVD” is the more specific disease category including things like coronary heart disease (CHD), myocardial infarction (i.e., heart attack), cerebrovascular disease / stroke, and peripheral arterial disease. Grundy 2019 In this section, we’ll be looking at the data for both of these hypotheses and see how this affects our red meat intake recommendations.
The Lipid-Heart Hypothesis
A lipid is defined as a fatty acid or their derivatives that are nonpolar and insoluble in water. For this reason, lipids need to be carried around the water-based bloodstream by proteins, called lipoproteins. To complicate matters, there are numerous classes and subclasses of lipoproteins. Lipoproteins are broadly classified by their “density”, i.e., their ratio of protein to lipid content. They include the categories of high-density lipoprotein (HDL), intermediate-density lipoprotein (IDL), low-density lipoprotein (LDL), very-low-density lipoprotein (VLDL), chylomicrons (or “ultra” low density lipoproteins), and a few others; each of these categories contain subclasses of various lipoprotein species.
Other proteins found on the outer surface of these particles known as apolipoproteins are involved in mediating specific lipoprotein functions. The totality of the evidence strongly implicates the group of lipoproteins containing apolipoprotein B (apoB) as THE causative factor in ASCVD. Ference 2017 Atherosclerosis can involve the arteries supplying the heart, brain, organs, and other peripheral tissues, and increases the risk of cardiovascular events (e.g., heart attacks, stroke, and many others). NCEP 1988, Romm 1991, Manninen 1992, Adult Treatment Panel II 1993
At this point it is important to emphasize that these lipoprotein particles are NOT the same thing as cholesterol; they are the circulating particles that carry cholesterol and other lipid substances including triglycerides and fat-soluble vitamins, for example. The total mass of cholesterol carried on an LDL particles is routinely measured as LDL-C on the standard lipid panel. This is a cheaper and more easily accessible — though imperfect — proxy measurement for total LDL particle concentration (LDL-P). It turns out that the strongest correlate for cardiovascular risk based off of the standard lipid panel alone (i.e., without specifically measuring particle concentrations, apolipoprotein B levels, or other more advanced testing) is the non-HDL cholesterol concentration, i.e. total cholesterol minus HDL-cholesterol.
Evidence that high levels of these atherogenic apoB-containing lipoproteins (i.e., VLDL, IDL, LDL, and chylomicron particles), contribute to ASCVD comes from several sources: animal models, literature on individuals with genetic forms of hypercholesterolemia, epidemiological studies, mendelian randomization studies, genome-wide association studies, and controlled trials. Ference 2018, Ference 2017 In other words, there is a large body of research involving multiple converging lines of evidence, all pointing to the same thing — which makes it surprising (and frustrating) that there continues to be such controversy around the role of blood lipids in cardiovascular disease.
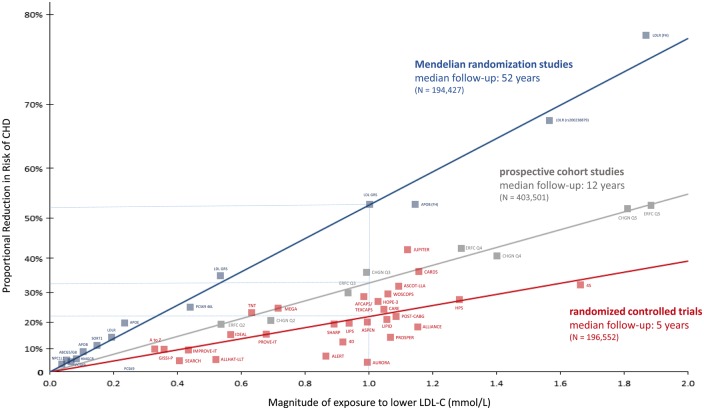
Figure 1. From Ference et al 2017: Log-linear association per unit change in low-density lipoprotein cholesterol (LDL-C) and the risk of cardiovascular disease as reported in meta-analyses of Mendelian randomization studies, prospective epidemiologic cohort studies, and randomized trials. The increasingly steeper slope of the log-linear association with increasing length of follow-up time implies that LDL-C has both a causal and a cumulative effect on the risk of cardiovascular disease
At this point, we have 200+ studies with greater than 2 million participants and over 20 million person-years of follow up, and 150,000+ cardiovascular events demonstrating a dose-dependent, log-linear association with absolute magnitude of vascular exposure to LDL and risk of ASCVD. Furthermore, we have over 30 randomized controlled trials with 200,000+ participants and 30,000 ASCVD events evaluating therapies designed to lower LDL particle concentrations showing a reduction in ASCVD event rates in proportional to the absolute reduction in blood LDL levels. In the context of the lipid-heart hypothesis, the relationship shown throughout the data is that for every 1 mmol/L or 38 mg/dL reduction in LDL, there’s about a 20% reduction in ASCVD rates. Cardoso 2018 For graphical depictions of this overall body of evidence, see Figures 1 and 2.
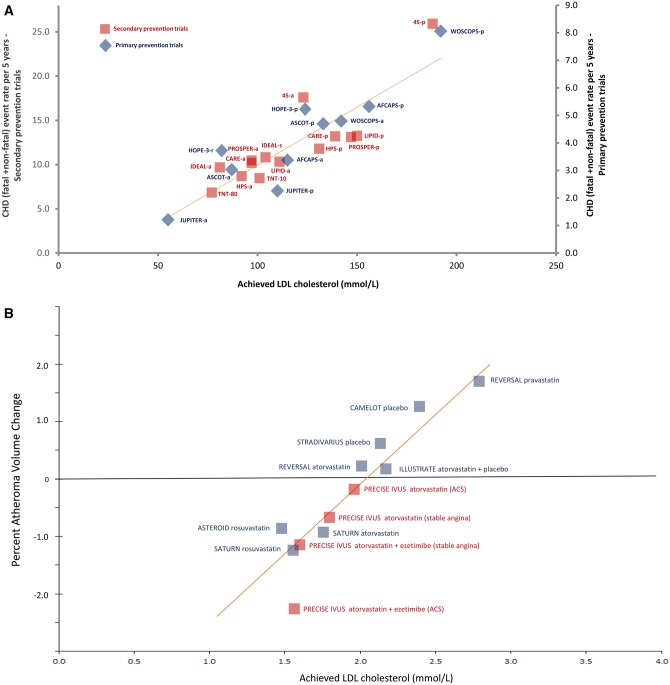
Figure 1. From Figure 2. From Ference et al 2017: Linear association between achieved low-density lipoprotein cholesterol (LDL-C) level and absolute coronary heart disease (CHD) event rate or progression of atherosclerosis. Panel A shows absolute cardiovascular event rates in randomized statin trials and Panel B shows progression of atherosclerosis as measured by intravascular ultrasound.
Historical data from U.S. population studies suggest that optimal total blood cholesterol levels are about 150 mg/dL, which corresponds to an LDL-cholesterol level of about 100 mg/dL. Stamler 1986, Kannel 1971 As we’d expect, adult populations with cholesterol concentrations in this range manifest the lowest rates of ASCVD (Ezatti 2004) — however, it should be noted that cardiovascular disease is a complex pathophysiologic process where elevated blood lipids are not the only risk factor (Yusuf 2004), so it is common to find exceptions to these numbers, particularly in the presence of other risk factors (e.g., smoking, inflammation, high blood sugar), although the underlying pathophysiology always involves apoB-containing lipoproteins. So while the LDL-cholesterol goal of 100 mg/dL is supported by the 2016 European Society of Cardiology guidelines for primary prevention of ASCVD, this isn’t a universal rule and it gives us a chance to discuss the differences between primary and secondary prevention, the concept of risk reduction, and the diet-heart hypothesis. Catapano 2016
ASCVD Risk Reduction
Primary prevention of cardiovascular events (i.e., heart attack, stroke, etc.) focuses on preventing the events from happening in the first place by targeting known risk factors for such events. Thus, risk reduction in this context refers to how an intervention changes the probability of a first cardiovascular event from ever occurring. In contrast, secondary prevention focuses on treating those who already have cardiovascular disease to reduce the risk of complications, or to delay the progression of disease.
In order to estimate an individual’s risk for a cardiovascular event, current guidelines recommend using validated models such as the Pooled Cohort Equation or Framingham model, which combine risk factors like age, sex, race, smoking status, presence of diabetes, cholesterol levels, and blood pressure (USPSTF 2018) to calculate a 10-year risk estimate. This score represents the risk of a cardiovascular event in the next 10 years and is used to help make clinical decisions that are designed to reduce the risk. In the context of blood lipids, this means initiating lifestyle interventions with or without medications, directed at lowering blood lipoprotein concentrations.
We’ll discuss how nutritional changes can influence ASCVD risk later, but for the purposes of illustrating individual risk reduction, we’ll use two patient examples for which the decision to start medications may differ despite both patients having the same LDL-C level (to experiment with these numbers for yourself, check out the Statin Decision aid):
- A 45-year-old non-smoking caucasian woman with normal blood pressure and an LDL cholesterol of 155 mg/dL and a high-density lipoprotein cholesterol (HDL-C) of 40 mg/dL has an estimated 10-year risk of a cardiovascular event of approximately 1% (i.e., of 100 individuals like her, only 1 will have a heart attack or stroke in the next 10 years). Given that statins generally confer a 20-30% relative risk reduction, this patient’s risk could be reduced by a total of about 0.2 to 0.3 percentage points (i.e., 20-30% of her initial 1% risk) if she were treated with a statin daily for 10 years — an arguably trivial amount without clinical significance.
- A 60-year-old man who smokes, has normal blood pressure, and the same LDL-C of 155 mg/dL and HDL-C of 40 mg/dL has an estimated 10-year risk of a cardiovascular event of approximately 11% (i.e., of 100 individuals like him, 11 will have a heart attack or stroke in the next 10 years). Use of a statin would reduce this risk by 3 to 4 points, down to approximately 7 to 8 percent. This means that for every 100 patients treated, 3-4 heart attacks would be prevented (i.e., a Number Needed to Treat of 25-33) — and this is reasonable medical intervention to consider on a population level, as these benefits may outweigh the risks.
We use these examples to illustrate that the expected benefit is directly related to the individual’s baseline risk. In other words, among individuals whose baseline risk is estimated to be very low, the absolute benefits of statin therapy may indeed not outweigh the risk of adverse events, and statins would therefore not be recommended in this situation. Conversely, current guidelines recommend that individuals with a 10-year ASCVD risk of >10% be considered for initiation of statin therapy in addition to lifestyle modifications, as the risk-benefit balance in this cohort is more favorable.
However, it should be noted based on the Cholesterol Treatment Trialists meta-analysis of 26 clinical trials and 170,000 patients, that treating any level of LDL cholesterol with statins shows at least some relative benefit with regards to reducing ASCVD risk, particularly over the long term and when blood lipids are lowered earlier in life. Baigent 2010. Robinson 2018 We aren’t suggesting this, however, as these sorts of data points have led to ridiculous, overly cavalier comments about “putting statins in the water”.
Finally, with respect to non-cardiovascular benefits of statins, He et al. performed an umbrella review of meta-analyses on the topic and found no convincing evidence of an association between statins and improvements in most non-cardiovascular disease outcomes, so we generally do not recommend their use for non-cardiovascular conditions. He 2018
The Diet-Heart Hypothesis
To review, the diet-heart hypothesis holds that reducing dietary saturated fat will reduce serum cholesterol levels, which is in turn protective against atherosclerosis and ultimately reduces the risk of ASCVD per the lipid hypothesis. To be clear, the lipid hypothesis is extremely well-supported by the available evidence Ference 2017, but the diet-heart hypothesis often gets a little more push back. Let’s investigate!
To begin, all fats are chemically similar in that they are a chain of carbon atoms bonded to hydrogen atoms. Different types of fats have different lengths and shapes of the carbon chain and are connected to different amounts of hydrogen atoms.
Take trans-fat for example, they have a double bond between two of the carbon atoms. That double bond results in one less hydrogen atom bonded to each of the carbon involved in the double bond. Together, these chemical changes produce a unique “kink” in the molecular structure that makes it more reactive with human tissues, e.g. blood vessels, organs, etc. Subsequently, for every 2% of calories consumed from trans fat daily, the risk of ASCVD increases by 23%. Iqbal 2014 For this reason, trans-fats were banned in the United States in May of 2019 — and it is notable that this was determined and carried out without a randomized controlled trial, representing a success of nutritional epidemiology.
Saturated fats are unique in that each carbon in the chain holds as many hydrogen atoms as possible, which means that each carbon is saturated in chemistry terms. Saturated fats are found in foods like fatty cuts of red meat (e.g. beef, pork), dairy (e.g. whole milk, butter), and tropical oils (coconut oil, palm oil, etc.) among others.
Saturated fat isn’t inherently good or bad, and we’d like to get away from that type of reductionist thinking. Like other foods and behaviors, context matters when we’re discussing whether something is health-promoting or potentially harmful.
For example, the current American Heart Association and American College of Cardiology Guidelines recommend a saturated fat intake of 5-6% of total daily calorie intake. Eckel 2013 The 2015-2020 Dietary Guidelines for Americans are a bit more moderate and recommend that saturated fat make up <10% of total daily calorie intake. 2015-2020 Dietary Guidelines The context for these recommendations is as follows; while the average American consumes about 11% of total daily calories from saturated fat, only about 5% of adults consume <7%, and 30-40% consume <10%. Rehm 2016, 2015 Dietary Guidelines Scientific Report Practically speaking, a 10-ounce ribeye steak contains about 28 grams of saturated fat, which would represent about 10% of total daily Calories for someone consuming 2500 Calories per day.
Increases in saturated fat intake do indeed tend to increase apoB-containing lipoproteins (via, e.g., effects on LDL receptor-mediated clearance of these particles from the bloodstream), which has been shown repeatedly in a number of metabolic ward and controlled feeding studies. Taken a step further, this means that for at least half of the adult US population we’d expect to see some reduction in ASCVD risk by reducing saturated fat intake. However, given that we don’t want a calorie deficit-induced weight loss to confound our observations, we should examine the effects of isocaloric substitution of other nutrients for saturated fat intake. So, let’s see what happens when we replace dietary saturated fat with other foods:
- Polyunsaturated Fatty Acids (PUFA) – Chemically speaking, PUFA are fats that have more than one double bond, thus making them poly- (more than one) unsaturated (not saturated with hydrogen atoms). Foods such as fish (salmon, mackerel, albacore tuna, etc.), walnuts, sunflower seeds, and vegetable oils are rich in PUFAs. At present, the data suggest that replacing 5% of energy intake from saturated fat with PUFA reduces blood LDL levels enough to generate a 25% reduction in cardiovascular risk. Li 2015 With that said, if someone is not consuming greater than the recommended amount of saturated fat, replacing saturated fat with PUFAs doesn’t tend to do much. Abdelhamid 2018 In other words, the level of benefit depends on the baseline level of intake — for populations already consuming a low amount of saturated fat, the benefits of replacement will be minimal to none, whereas for populations consuming high amounts of saturated fat (e.g., >18% of calories), the benefits are clear.
- Monounsaturated Fats (MUFA) – In contrast to the multiple double-bond containing PUFAs, MUFAs only have one double bound. Foods such as nuts (almonds, cashews, pecans, etc.), nut butters, olives, and olive oil are rich in MUFAs. When using MUFAs to replace 5% of daily calorie intake from saturated fat we see an approximately 15% lower cardiovascular risk stemming mostly from a reduction in apoB containing lipoproteins. Li 2015
- Complex Carbohydrates – Complex carbohydrates are made up of long chains of glucose molecules and typically contain some indigestible carbohydrates, i.e., fiber. Foods such as whole grains, oatmeal, vegetables, legumes, quinoa, potatoes, and brown rice are all complex carbohydrates. When we replace 10% of dietary calories coming from saturated fat with complex carbohydrates, we tend to see a reduction in LDL-cholesterol that correlates with an approximately ~9% reduction in ASCVD risk. Clarke 2015,Li 2015
- Sugar / Refined carbohydrates – In contrast to long-chained complex carbohydrates, sugar is made up of two molecules joined together and contains no fiber. For example, table sugar (sucrose) is composed of the molecules glucose and fructose. When we replace saturated fat with sugar or similar, we don’t see a significant change in cardiovascular risk.Li 2015
For a clear graphical representation of these effects on cardiovascular risk, see Figure 3. here.
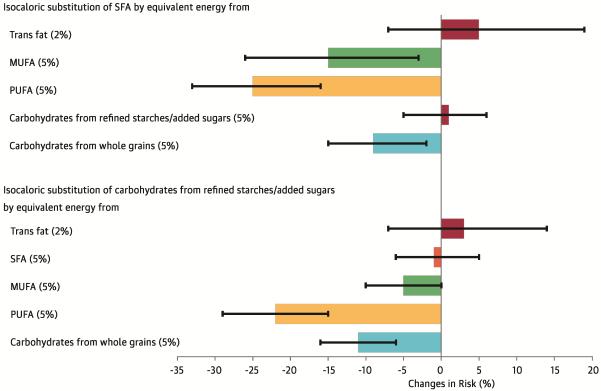 Figure 3. From Li et al 2016. Changes in risk are derived from hazard ratios and represented as solid bars; I bars represent 95% confidence intervals. The model was adjusted for: total energy intake; the energy contribution from protein; cholesterol intake; alcohol intake; smoking status; body mass index; physical activity; use of vitamins and aspirin; family history of myocardial infarction and diabetes; and presence of baseline hypercholesterolemia and hypertension.
Taken together, the diet-heart hypothesis appears to have adequate support when saturated fat intakes greater than ~10% of total daily calories. However, if we wanted to design a study protocol that showed saturated fat intake didn’t matter, we’d compare two groups who both consumed <10% of their daily calories from saturated fat. If the “high” and “low” saturated fat groups are getting 8% and 5% of their daily calories from saturated fat, for example, then both groups are following the current guidelines and we would be unlikely to see a difference between “high” and “low” intakes.
Alternatively, the studies claiming that saturated fat intake makes no difference in ASCVD risk or blood LDL levels may replace saturated fat with sugar or refined carbohydrates. Ultimately, this leads to more controversy rather than consensus. A recent review from Dr. Penny Kris-Etherton, an author of the American Heart Association’s Diet and Lifestyle Recommendations, summarizes the problem:
“Epidemiological research that ignores nutrient differences in diets across the spectrum of SFA intake demonstrates no association of SFA with CVD risk. SFA intake is typically lowered and proportional increases in refined carbohydrates occur. Thus, the appropriate conclusion is that SFA and refined carbohydrates are equally deleterious on CVD risk. The controversy about the clinical trial evidence stems from studies with methodological problems and inclusion of these studies in meta-analyses.” Kris-Atherton 2018
Finally, the latest Cochrane review of 15 RCT’s suggest that reducing dietary saturated fat from high levels of intake to <10% of calories reduces ASCVD events by 17%, while also promoting weight loss. Furthermore, the degree of reduction in cardiovascular events was related to the degree of reduction in total cholesterol levels in the blood. While the impact on mortality (death) was unclear, there was no evidence of harm from reducing saturated fat intake with respect to cancer diagnosis, cancer mortality, or blood pressure; similarly, there is no benefit to significantly increasing saturated fat intake that we would be sacrificing by making such nutritional interventions. Hooper 2015
Overall, it seems reasonable to conclude that most would benefit from reducing their saturated fat intake to 10% or less of their daily Calorie intake. This recommendation is strongest for those at high cardiovascular risk, including those with significant abnormalities in blood lipids, certain genetic conditions, etc. Weight loss may also be beneficial for overweight or obese individuals in addition to reducing saturated fat inake to the recommended level.
With respect to bodyweight and ASCVD risk, the data are similarly complicated. For example, longitudinal data from young adults gaining weight in the CARDIA study shows that dyslipidemia (defined here as low HDL cholesterol and high triglycerides) is the first risk factor for cardiovascular disease to appear over the subsequent 20 years, occurring before obesity, high cholesterol, high blood pressure, or diabetes. Paynter 2015.
With weight loss, a brief overview of the representative literature suggests that weight loss has a beneficial effect on blood lipids. Bays 2013, Miller 2011, Viljoen 2012, Pasanisi 2001, Van Gaal 2005 Weight loss of 5 to 10% has been shown to produce in a 20% decrease in triglycerides, a 15% reduction in LDL cholesterol, and an 8 to 10% increase in HDL cholesterol. Nordmann 2006 Greater degrees of weight loss can achieve progressive improvements in blood lipids in some individuals. Wing 2011 This “LDL cholesterol” effect was confirmed by a recent study that showed good adherence to nearly any LDL-lowering diet will reduce LDL cholesterol by 10% to >15%. Chiavaroli 2018
On the other hand, The Framingham Heart study showed an increase in HDL cholesterol and a decrease in triglycerides over 10 years in 1,666 subjects whose BMI increased during the same time frame. Ingelsson 2009 While LDL cholesterol levels are a major risk factor for cardiovascular disease, elevated BMI doesn’t necessarily have a direct effect on circulating LDL cholesterol levels, and elevations in LDL cholesterol as well as ASCVD can occur in patients with and without obesity. Garrison 1980
All of this is to say that while excess body fat can certainly contribute to elevated LDL cholesterol and other risk factors for ASCVD, it isn’t universally true. Furthermore, we may need additional interventions (including medications) for patients who stand to benefit from further risk reduction. For example, the data discussed above suggests that dietary interventions tend to reduce LDL cholesterol by 10-15%, whereas the current cholesterol guidelines recommend much greater reductions for both primary and secondary prevention of cardiovascular disease. For the primary prevention of ASCVD in intermediate- and high-risk individuals, the American Heart Association guidelines recommend reducing blood LDL cholesterol levels by 30-49% and >50%, respectively. Grundy 2019 For secondary prevention of ASCVD, these same guidelines recommend a 50% reduction or more in circulating LDL cholesterol in most cases.
Statin critics often assume that medical professionals fail to appreciate or recommend lifestyle interventions for managing cardiovascular risk, despite the strong recommendation for implementing lifestyle modifications for all patients, at all levels of risk, in all official clinical practical guidelines. Lifestyle modifications centering around exercise, diet, and weight loss have indeed been shown to significantly reduce ASCVD risk by improving cholesterol levels, blood pressure, preventing diabetes, and many other mechanisms. With that said, sometimes patients remain at unacceptably high risk despite lifestyle changes, or may not be able to adhere to the lifestyle interventions for numerous reasons ranging from genetic predispositions to other complex psychosocial factors such as socioeconomic status and mental health status. For example, the healthiest diets cost about $1.50 more per day ($550 a year) when compared to the unhealthiest diets as defined by various metrics.Rao 2013 In these situations where significant residual risk remains after lifestyle interventions, we can achieve clinically significant risk reductions with the appropriate use of medications, and it does not make sense to leave this treatable residual risk “on the table” out of misplaced fears about medications.
The Take Home Message
Overall, reconciling the existing guidelines with the new recommendations for red meat and processed red meat intake requires additional context. To review, the existing guidelines and new recommendations are as follows:
Existing Guidelines
- 2015–2020 Dietary Guidelines for Americans recommend limiting red meat intake to about 1 serving per week and that saturated fat make up <10% of total daily calorie intake. 2015-2020 Dietary Guidelines
- The World Cancer Research Fund (WCRF) recommends that individuals consume no more than 3 portions per week of unprocessed red meat and little, if any, processed red meat. WCRF 2018
- The UK’s National Health Service (NHS) agrees with the WCRF and advises that people should limit consumption of all red meat to 490 grams per week.NHS 2018
- The American Heart Association and American College of Cardiology Guidelines recommend a saturated fat intake of 5-6% of total daily calorie intake. Eckel 2013
New Recommendations
- The panel suggests that adults continue current unprocessed red meat consumption. Similarly, the panel suggests adults continue current processed meat consumption. Johnston 2019
At first glance, the new recommendations appear to contradict the existing guidelines. However, the average red meat consumption in the US and most European countries is about 70 grams per day or 490 grams per week, which is actually within the current guidelines’ suggestions. Additionally, the average American consumes about 11% of total daily calories from saturated fat, which is close to the 10% recommendation put forth by the 2015-2010 Dietary Guidelines for Americans.Rehm 2016 Finally, red meat isn’t even in the top five food sources of dietary saturated fat for Americans, which are (in order): 1) regular cheese, 2) pizza, 3) grain-based desserts, 4) dairy desserts, and 5) chicken dishes. NHANES 2006 However, this isn’t to say that saturated fat from dairy or red meat have the same effects on risk either, as this may not be the case; some dairy sources actually appear to confer a reduced risk or neutral effect (e.g., milk, cheese, yogurt). O’Sullivan 2013 Rather, the NutriRECs may have interpreted this list as further evidence that average folks may not be consuming that much saturated fat from red meat at present.
Taken together with the existing data suggesting that the benefits of further reducing red meat or saturated fat intake are likely to be small for most individuals, I can see how the NutriRECs Consortium came to their conclusions. In short, from a population level it might not be the best place to focus our energy and resources on to promote behavioral changes surrounding dietary patterns.
On the other hand, the paper’s conclusions might be misleading due to how they are being covered in the mainstream media and popular Internet health outlets. For example, while the average intake of saturated fat in America is ~11% of total daily calories, only about 35-45% of people consume <10%. Rehm 2016, 2015 Dietary Guidelines Scientific Report
In addition, many popular diets are now advising individuals to consume more red meat, despite the average American or European citizen’s intake being within the current guidelines’ suggestions. In summary, telling people to reduce their red meat and/or saturated fat intake doesn’t do much good for those who are already within the recommended ranges. However, telling folks to increase red meat or saturated fat intake above the recommended ranges probably doesn’t have a favorable risk / benefit trade-off either. To be fair, the NutriRECs Consortium authors did not recommend to do that – but they didn’t make any recommendations of what folks SHOULD do in order to improve their health either.
In our view, we think the following items are important in designing a health-promoting dietary pattern:
- Total daily Calorie intake should achieve healthy body fat and muscle mass levels, while also supporting appropriate amounts of physical activity. Vegetarian and vegan approaches can be utilized based on individual preferences, as vegans and vegetarians tend to eat an average of 600 and 263 fewer Calories per day compared to those who eat both plants and meat, respectively. Clarys 2014
- Total dietary protein intake should fall between 1.6-3.1 grams per kilogram body weight per day, unless medically contraindicated. Those who are gaining or maintaining weight should aim for the lower to middle-range, whereas those who are losing weight and/or who have risk factors for anabolic resistance may aim for the middle to upper range. For those able to consume protein within this range, we are not concerned about animal/marine versus plant sources of protein, as plant protein sources appear to be equivalent to animal protein sources when dosed at this level. In contrast, this distinction may have more relevance for individuals needing to consume a protein-restricted diet. Babault 2015,Joy 2013, Hartman 2007
- Total dietary fiber intake should be at least 25-30 grams per day, ideally sourced from vegetables, fruits, and complex carbohydrate sources. Reynolds 2019 We recommend eating as many servings of fruits and vegetables as is consistent with the total calorie and protein goals mentioned above. Fiber intake may also mitigate some of the potential negative effects of a diet high in saturated fat. Wallstrom 2012
- Dietary fat intake should be primarily unsaturated, e.g. from marine and plant sources, with saturated fat limited to approximately 10% or less of total Calories. When replacing saturated fat with other nutrients, we recommend foods rich in PUFA, MUFA, or complex carbohydrates depending on an individual’s preferences, Calorie goal, and individual response to the diet. This recommendation is strongest for those at elevated cardiovascular risk. With respect to red meat, the current recommendation of limiting intake to 12-18 ounces of cooked red meat per week is reasonable, although we feel less strongly about this if the other criteria above are being met. Processed red meat should be limited to less than 1.7 ounces (50 grams) per day.
So, should you reduce your red meat or saturated fat intake? If you’re over the threshold of the current recommendations, there may be some benefits with such an approach. If already doing everything else on the list above, it’s probably a TWOUD – time wasted on useless detail.
Special thanks to Dr. Austin Baraki for help in editing this article.
This article was written by Jordan Feigenbaum. The idea behind the article was to take a closer look at the source data behind the current recommendations for red meat intake and try to get a sense of how important adhering to those recommendations are for health. While there are ethical, environmental, and other considerations surrounding red meat intake, I felt that those topics deserve their own treatment and intentionally left them out of this article that was already getting pretty long.
So, what do you think? Let us know in the comments below and share the article on social media 🙂
References
- Johnston BC, Zeraatkar D, Han MA, et al. Unprocessed Red Meat and Processed Meat Consumption: Dietary Guideline Recommendations From the Nutritional Recommendations (NutriRECS) Consortium. Ann Intern Med. 2019; doi: 10.7326/M19-1621
- Vegetarianism by country. Wikipedia. 2019 [cited 2019 Nov 5]. Available from: https://en.wikipedia.org/wiki/Vegetarianism_by_country.
- Anon. (2012) Thomson Reuters–NPR Health Poll: Meat Consumption 2012, March 2012. https://truvenhealth.com/portals/0/NPR-Truven-Health-Poll/NPR_report_MeatConsumption_1203.pdf (accessed November 2019).
- Barclay E & Aubrey A (2016) Eat less meat, we’re told. But Americans’ habits are slow to change. The Salt, 26 February.
- http://www.npr.org/sections/thesalt/2016/02/26/465431695/eat-less-meat-were-told-but-americans-habits-are-slow-to-change (accessed November 2019).
- Daniel CR, Cross AJ, Koebnick C, et al. Trends in meat consumption in the USA. Public Health Nutr. 2011;14:575-83.
- Statistics Canada. Canadian Community Health Surveys (Nutrition) 2004 and 2015. 2018. Accessed at https://bit.ly/345MLDu
- 26. United Kingdom meat consumption. Results of the National Diet and Nutrition Survey (NDNS) rolling programme for 2014 to 2015 and 2015 to 2016. 2019. Accessed at https://bit.ly/2BNQWI2
- Suarez MV, Man˜ as RJ, Ferna´ ndez SR, et al. Spanish national dietary survey in adults, elderly and pregnant women. EFSA J. 2016; 13. Accessed at https://bit.ly/345AEWO
- Micha R, Khatibzadeh S, Shi P, et al; Global Burden of Diseases Nutrition and Chronic Diseases Expert Group (NutriCoDE). Global, regional and national consumption of major food groups in 1990 and 2010: a systematic analysis including 266 country-specific nutrition surveys worldwide. BMJ Open. 2015.
- Appleby, P. N., & Key, T. J. (2015). The long-term health of vegetarians and vegans. Proceedings of the Nutrition Society, 75(03), 287–293. doi:10.1017/s0029665115004334
- IARC Working Group on the Evaluation of Carcinogenic Risk to Humans. Red Meat and Processed Meat. Lyon (FR): International Agency for Research on Cancer; 2018
- Monteiro CA, Cannon G, Levy RB et al. NOVA. The star shines bright. [Food classification. Public health] World Nutrition January-March 2016, 7, 1-3, 28-38
- International Agency for Research on Cancer. Volume 114: Consumption of red meat and processed meat. IARC Working Group. Lyon; 6–13 October, 2015. IARC Monogr Eval Carcinog Risks Hum (in press). DOI: 10.1016/S1470-2045(15)00444-1
- NHS. Red meat and the risk of bowel cancer. 2018. https://www.nhs.uk/live-well/eat-well/red-meat-and-the-risk-of-bowel-cancer/
- World Cancer Research Fund/American Institute for Cancer Research. Diet, Nutrition, Physical Activity and Cancer: a Global Perspective. Continuous Update Project Expert Report 2019.
- Eckel RH, Jakicic JM, Ard JD, de Jesus JM, Houston Miller N, Hubbard VS, Lee I-M, Lichtenstein AH, Loria CM, Millen BE, Nonas CA, Sacks FM, Smith SC Jr, Svetkey LP, Wadden TA, Yanovski SZ. 2013 AHA/ACC guideline on lifestyle management to reduce cardiovascular risk: a report of the American College of Cardiology/American Heart Association Task Force on Practice Guidelines. Circulation. 2014;129(suppl 2):S76–S99.
- International Food Information Council. 2011 Food & Health Survey: Consumer Attitudes toward Food Safety, Nutrition, and Health.
- Ikuko Kato, Arslan Akhmedkhanov, Karen Koenig, Paolo G. Toniolo, Roy E. Shore & Elio Riboli (1997) Prospective study of diet and female colorectal cancer: The New York university women’s health study, Nutrition and Cancer, 28:3, 276-281, DOI: 10.1080/01635589709514588
- Spencer, E.A., Key, T.J., Appleby, P.N. et al. Cancer Causes Control (2010) 21: 1417. https://doi.org/10.1007/s10552-010-9569-7
- U.S. Department of Health and Human Services2015-2020 Dietary Guidelines for Americans.Washington, DCU.S. Department of Health and Human ServicesDecember 2015
- Guyatt GH, Oxman AD, Vist GE, et al. GRADE: an emerging consensus on rating quality of evidence and strength of recommendations. BMJ. 2008;336(7650):924–926. doi:10.1136/bmj.39489.470347.AD
- Beresford SAA, Johnson KC, Ritenbaugh C, et al. Low-Fat Dietary Pattern and Risk of Colorectal Cancer: The Women’s Health Initiative Randomized Controlled Dietary Modification Trial. JAMA. 2006;295(6):643–654. doi:https://doi.org/10.1001/jama.295.6.643
- Aykan NF. Red Meat and Colorectal Cancer. Oncol Rev. 2015;9(1):288. Published 2015 Dec 28. doi:10.4081/oncol.2015.288
- Brown, W. V. (1990). Review of clinical trials: proving the lipid hypothesis. European Heart Journal, 11(suppl H), 15–20. doi:10.1093/eurheartj/11.suppl_h.15
- Ramsden CE, Zamora D, Majchrzak-Hong S, et al. Re-evaluation of the traditional diet-heart hypothesis: analysis of recovered data from Minnesota Coronary Experiment (1968-73). BMJ. 2016;353:i1246. Published 2016 Apr 12. doi:10.1136/bmj.i1246
- Report of the National Cholesterol Education Program Expert Panel on Detection, Evaluation, and Treatment of High Blood Cholesterol in Adults. The Expert Panel. Arch Intern Med 1988; 148:36.
- Romm PA, Green CE, Reagan K, Rackley CE. Relation of serum lipoprotein cholesterol levels to presence and severity of angiographic coronary artery disease. Am J Cardiol 1991; 67:479.
- Manninen V, Tenkanen L, Koskinen P, et al. Joint effects of serum triglyceride and LDL cholesterol and HDL cholesterol concentrations on coronary heart disease risk in the Helsinki Heart Study. Implications for treatment. Circulation 1992; 85:37.
- Summary of the second report of the National Cholesterol Education Program (NCEP) Expert Panel on Detection, Evaluation, and Treatment of High Blood Cholesterol in Adults (Adult Treatment Panel II). JAMA 1993; 269:3015.
- Ference BA et al. Low-density lipoproteins cause atherosclerotic cardiovascular disease. Evidence from genetic, epidemiologic, and clinical studies. A consensus statement from the European Atherosclerosis Society Consensus Panel, European Heart Journal, Volume 38, Issue 32, 21 August 2017, Pages 2459–2472.
- Ference BA et al. Impact of Lipids on Cardiovascular Health. Journal of the American College of Cardiology Sep 2018, 72 (10) 1141-1156.
- Stamler J, Wentworth D, Neaton JD. Is relationship between serum cholesterol and risk of premature death from coronary heart disease continuous and graded? Findings in 356,222 primary screenees of the Multiple Risk Factor Intervention Trial (MRFIT). JAMA. 1986;256:2823-8.
- Kannel WB, Castelli WP, Gordon T, et al. Serum cholesterol, lipoproteins, and the risk of coronary heart disease. The Framingham study. Ann Intern Med. 1971;74:1-12.
- Ezzati M, Lopez AD, Rodgers A, et al, eds. Comparative Quantification of Health Risks: Global and Regional Burden of Disease Attributable to Selected Major Risk Factors. Geneva, Switzerland: World Health Organization; 2004:391-496.
- Yusuf S, Bosch J, Dagenais G, et al. Cholesterol Lowering in Intermediate-Risk Persons without Cardiovascular Disease. N Engl J Med 2016; 374:2021.
- Catapano AL, Graham I, De Backer G, et al. 2016 ESC/EAS Guidelines for the Management of Dyslipidaemias. Eur Heart J 2016; 37:2999.
- Baigent C, Blackwell L, Emberson J, et al. Efficacy and safety of more intensive lowering of LDL cholesterol: a meta-analysis of data from 170,000 participants in 26 randomised trials. Lancet. 2010;376:1670-81
- He Y, Li X, Gasevic D, et al. Statins and Multiple Noncardiovascular Outcomes: Umbrella Review of Meta-analyses of Observational Studies and Randomized Controlled Trials. Ann Intern Med 2018; 169:543.
- U.S. Preventive Services Task Force, Curry SJ, Krist AH, Owens DK, Barry MJ, Caughey AB, Davidson KW, Doubeni CA, Epling JW, Kemper AR, Kubik M, Landefeld S, Mangione CM, Silverstein M, Simon MA, Tseng C, Wong JB. Risk Assessment for Cardiovascular Disease With Nontraditional Risk Factors: US Preventive Services Task Force Recommendation Statement.JAMA. 2018; 320(3): 272-280. PubMed
- Cardoso, Rhanderson, et al. “How Low Should We Decrease LDL-Cholesterol in a Cost-Effective Manner?” American College of Cardiology, 16 Feb. 2018, https://www.acc.org/latest-in-cardiology/articles/2018/02/16/09/31/how-low-should-we-decrease-ldl-cholesterol-in-a-cost-effective-manner.
- Iqbal MP. Trans fatty acids – A risk factor for cardiovascular disease. Pak J Med Sci. 2014;30(1):194–197. doi:10.12669/pjms.301.4525
- Rehm CD, Peñalvo JL, Afshin A, Mozaffarian D. Dietary intake among US adults, 1999-2012.JAMA. 2016; 315:2542–2553. doi: 10.1001/jama.2016.7491
- Scientific Report of the 2015 Dietary Guidelines Advisory Committee. Washington, DC: US Department of Agriculture; 2015. https://health.gov/dietaryguidelines/2015-scientific-report/. Accessed November 2019.
- Clarke R, Frost C, Collins R, Appleby P, Peto R. Dietary lipids and blood cholesterol: quantitative meta-analysis of metabolic ward studies. BMJ. 1997;314(7074):112–117. doi:10.1136/bmj.314.7074.112
- Hooper L, Martin N, Abdelhamid A, Davey Smith G. Reduction in saturated fat intake for cardiovascular disease. Cochrane Database of Systematic Reviews 2015, Issue 6. Art. No.: CD011737. DOI: 10.1002/14651858.CD011737.
- Abdelhamid AS, Martin N, Bridges C, et al. Polyunsaturated fatty acids for the primary and secondary prevention of cardiovascular disease. Cochrane Database Syst Rev. 2018;7(7):CD012345. Published 2018 Jul 18. doi:10.1002/14651858.CD012345.pub2
- Li Y, Hruby A, Bernstein A, Ley S, Wang D, Chiuve S et al. Saturated Fats Compared With Unsaturated Fats and Sources of Carbohydrates in Relation to Risk of Coronary Heart Disease. Journal of the American College of Cardiology. 2015;66(14):1538-1548.
- Kris-Etherton PM, Petersen K, Van Horn LConvincing evidence supports reducing saturated fat to decrease cardiovascular disease riskBMJ Nutrition, Prevention & Health 2018;1:doi: 10.1136/bmjnph-2018-000009
- Paynter NP, Kiefe CI, Lewis CE, Loria CM, Goff DC, Lloyd-Jones DM. Accumulation of metabolic cardiovascular risk factors in black and white young adults over 20 years. J Am Heart Assoc. 2015;4(4):10.1161/ JAHA.114.001548
- Ingelsson E, Massaro JM, Sutherland P, et al. Contemporary trends in dyslipidemia in the Framingham Heart Study. Arch Intern Med. 2009;169(3):279-286
- Garrison RJ, Wilson PW, Castelli WP, Feinleib M, Kannel WB, McNamara PM. Obesity and lipoprotein cholesterol in the Framingham Offspring Study. Metabolism. 1980;29(11):1053-1060
- Bays HE, Toth PP, Kris-Etherton PM, et al. Obesity, adiposity, and dyslipidemia: a consensus statement from the National Lipid Association. J Clin Lipidol. 2013;7(4): 304-383.
- Miller M, Stone NJ, Ballantyne C, et al. Triglycerides and cardiovascular disease: a scientific statement from the American Heart Association. Circulation. 2011; 123(20): 2292-2333.
- Viljoen A, Wierzbicki AS. Diagnosis and treatment of severe hypertriglyceridemia. Expert Rev Cardiovasc Ther. 2012;10(4):505-514.
- Pasanisi F, Contaldo F, de Simone G, Mancini M. Benefits of sustained moderate weight loss in obesity. Nutr Metab Cardiovasc Dis. 2001;
- Van Gaal LF, Mertens IL, Ballaux D. What is the relationship between risk factor reduction and degree of weight loss? Eur Heart J Suppl. 2005;7(Suppl L): L21- L26.
- Nordmann AJ, Nordmann A, Briel M, et al. Effects of low-carbohydrate vs low-fat diets on weight loss and cardiovascular risk factors: a meta-analysis of randomized controlled trials. Arch Intern Med. 2006;166(3):285-293.
- Wing RR, Lang W, Wadden TA, et al. Look AHEAD Research Group. Benefits of modest weight loss in improving cardiovascular risk factors in overweight and obese individuals with type 2 diabetes. Diabetes Care. 2011;34(7):1481-1486
- Chiavaroli L, Nishi SK, Khan TA, et al. Portfolio dietary pattern and cardiovascular disease: a systematic review and meta-analysis of controlled trials. Prog Cardiovasc Dis. 2018;61:43- 53.
- Clarys P, Deliens T, Huybrechts I, et al. Comparison of nutritional quality of the vegan, vegetarian, semi-vegetarian, pesco-vegetarian and omnivorous diet. Nutrients. 2014;6(3):1318–1332. Published 2014 Mar 24. doi:10.3390/nu6031318
- National Cancer Institute Applied Research Program [Internet]. Bethesda (MD): National Cancer Institute Applied Research Program [updated 2013 Oct 18; cited 2015 Jan 3]. Available from: http://appliedresearch.cancer.gov/diet/foodsources/sat_fat/sf.html.
- Reynolds, A., Mann, J., Cummings, J., Winter, N., Mete, E., & Te Morenga, L. (2019). Carbohydrate quality and human health: a series of systematic reviews and meta-analyses. The Lancet. doi:10.1016/s0140-6736(18)31809-9
- Rao M, Afshin A, Singh G, Mozaffarian D. Do healthier foods and diet patterns cost more than less healthy options? A systematic review and meta-analysis. BMJ Open 2013;3.
- Babault N., Païzis C., Deley G., Guérin-Deremaux L., Saniez M.-H.,Lefranc-Millot C., Allaert F.A. Pea proteins oral supplementation promotes muscle thickness gains during resistance training: A double-blind, randomized, placebo-controlled clinical trial vs. Whey protein. J. Int. Soc. Sports Nutr. 2015;12:3.
- Joy J.M., Lowery R.P., Wilson J.M., Purpura M., De Souza E.O., Wilson S.M., Kalman D.S., Dudeck J.E., Jäger R. The effects of 8 weeks of whey or rice protein supplementation on body composition and exercise performance. Nutr. J.2013;12:86
- Hartman J.W., Tang J.E., Wilkinson S.B., Tarnopolsky M.A., Lawrence R.L., Fullerton A.V., Phillips S.M. Consumption of fat-free fluid milk after resistance exercise promotes greater lean mass accretion than does consumption of soy or carbohydrate in young, novice, male weightlifters. Am. J. Clin.Nutr. 2007;86:373–381
- Wallström P, Sonestedt E, Hlebowicz J, et al. Dietary fiber and saturated fat intake associations with cardiovascular disease differ by sex in the Malmö Diet and Cancer Cohort: a prospective study. PLoS One. 2012;7(2):e31637. doi:10.1371/journal.pone.0031637
- O’Sullivan TA, Hafekost K, Mitrou F, Lawrence D. Food sources of saturated fat and the association with mortality: a meta-analysis. Am J Public Health. 2013;103(9):e31–e42. doi:10.2105/AJPH.2013.301492